Perspectives
May 12, 2020

I’ve always been fascinated by sound. Not only because I love listening to and playing music (I’m a drummer), but also because I’m an architect. I realise that might sound strange, but there is an incredible amount of information to be gleaned from how sound interacts with the built environment, that can help to shape our work as designers.
Sound is different from almost any other environmental data we can collect because it is multi-layered. A single field recording can carry thousands of clues about an area, from traffic congestion levels, to excessive noise from local businesses, and even the different wildlife species that may be present.
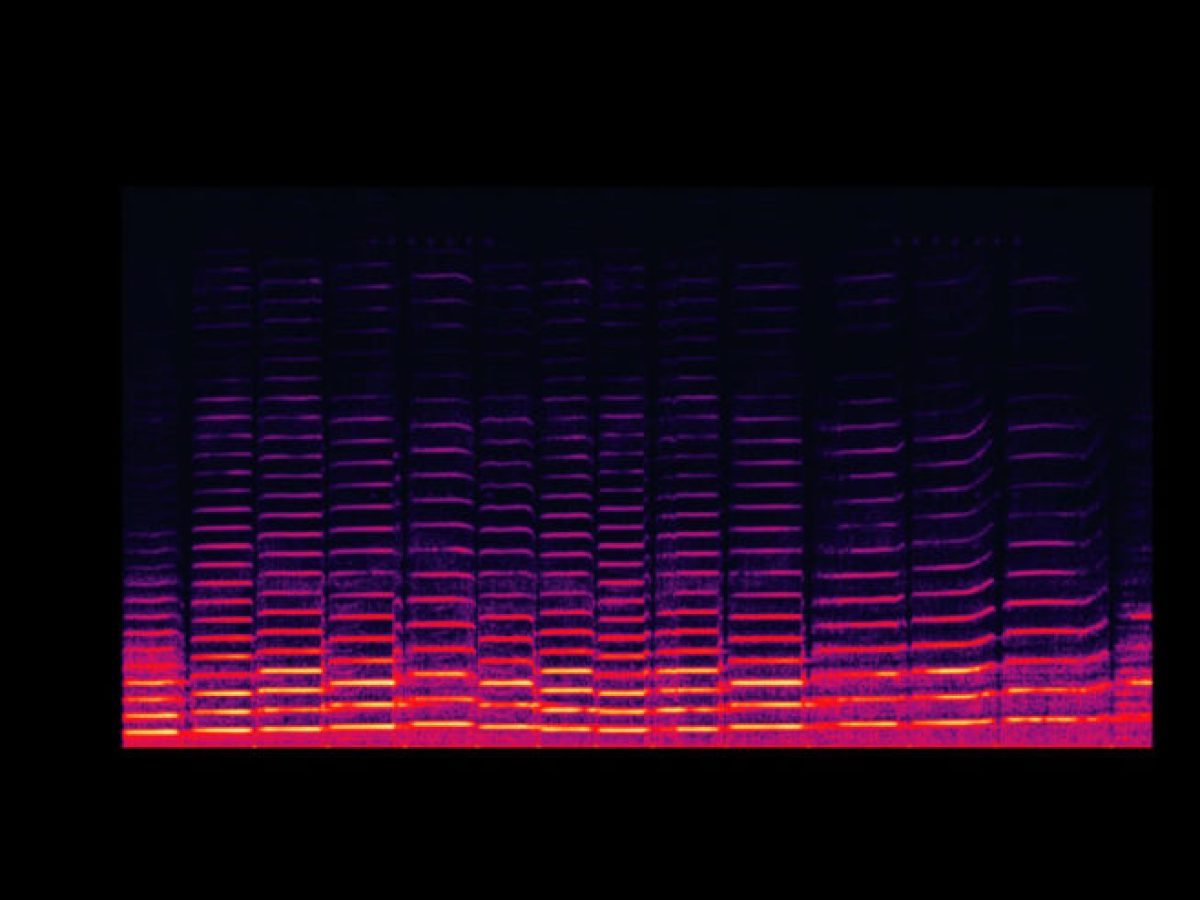
As architects, that level of insight is priceless. But to fully understand the benefits of sound as a design tool, we need to visualise it. The first step in that process is creating a computer-generated image called a spectrogram. This is the simplest form of sound visualisation, setting out on a graph the pitch (y-axis), duration (x-axis) and loudness (colour intensity) of the audio signal. By combining the data from many spectrograms together, it is possible to build more complex, site-specific 3D models of the sonic environment. These types of models are called soundscapes.
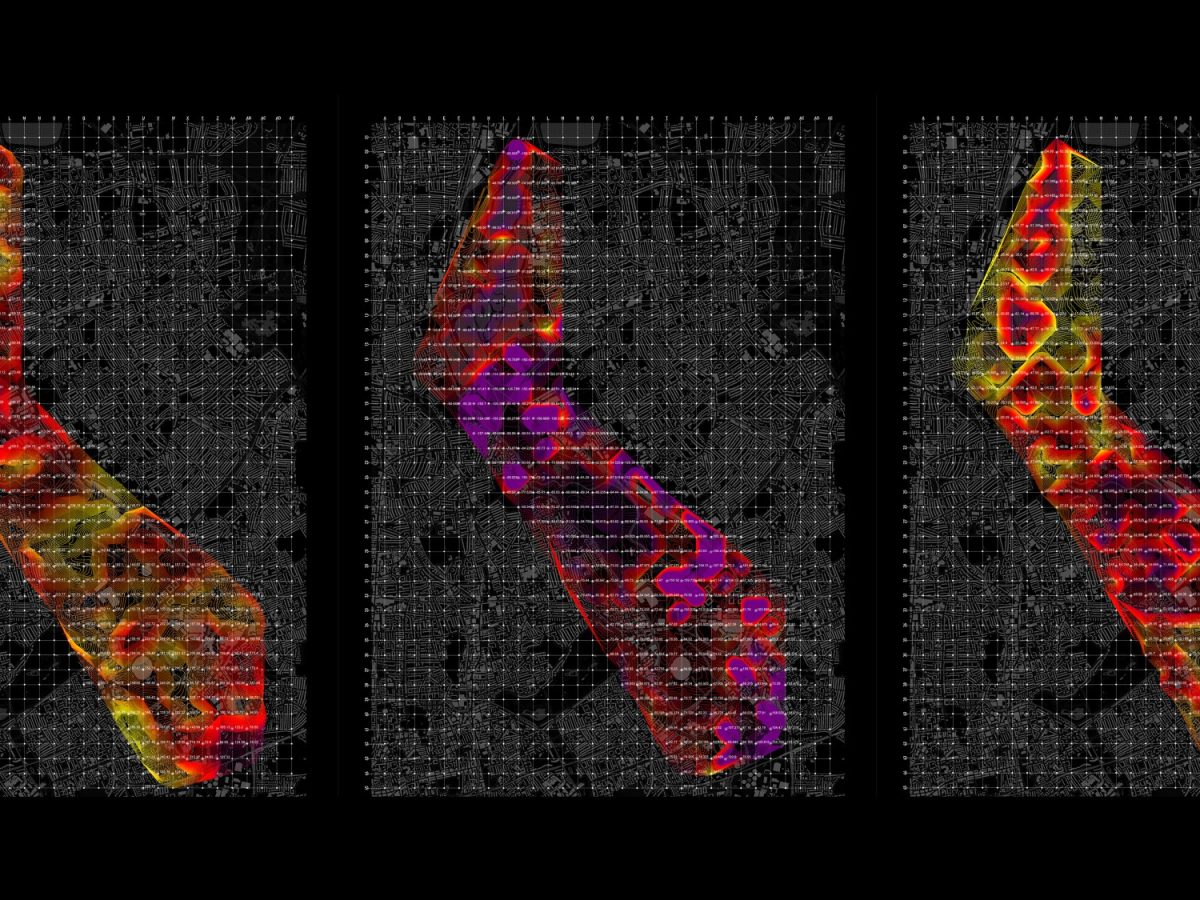
Applied in an architectural context, soundscape studies allow us to identify sonic ‘hot spots’. These are the areas of a site where environmental noise would negatively impact the users of a building, usually because it’s too loud, or because the pitch or resonance of the sound is painful to the human ear. Armed with this knowledge, we can then adjust our plans accordingly by remodelling specific sections of façade to buffer the noise or, in more extreme cases, by altering the form of the building.
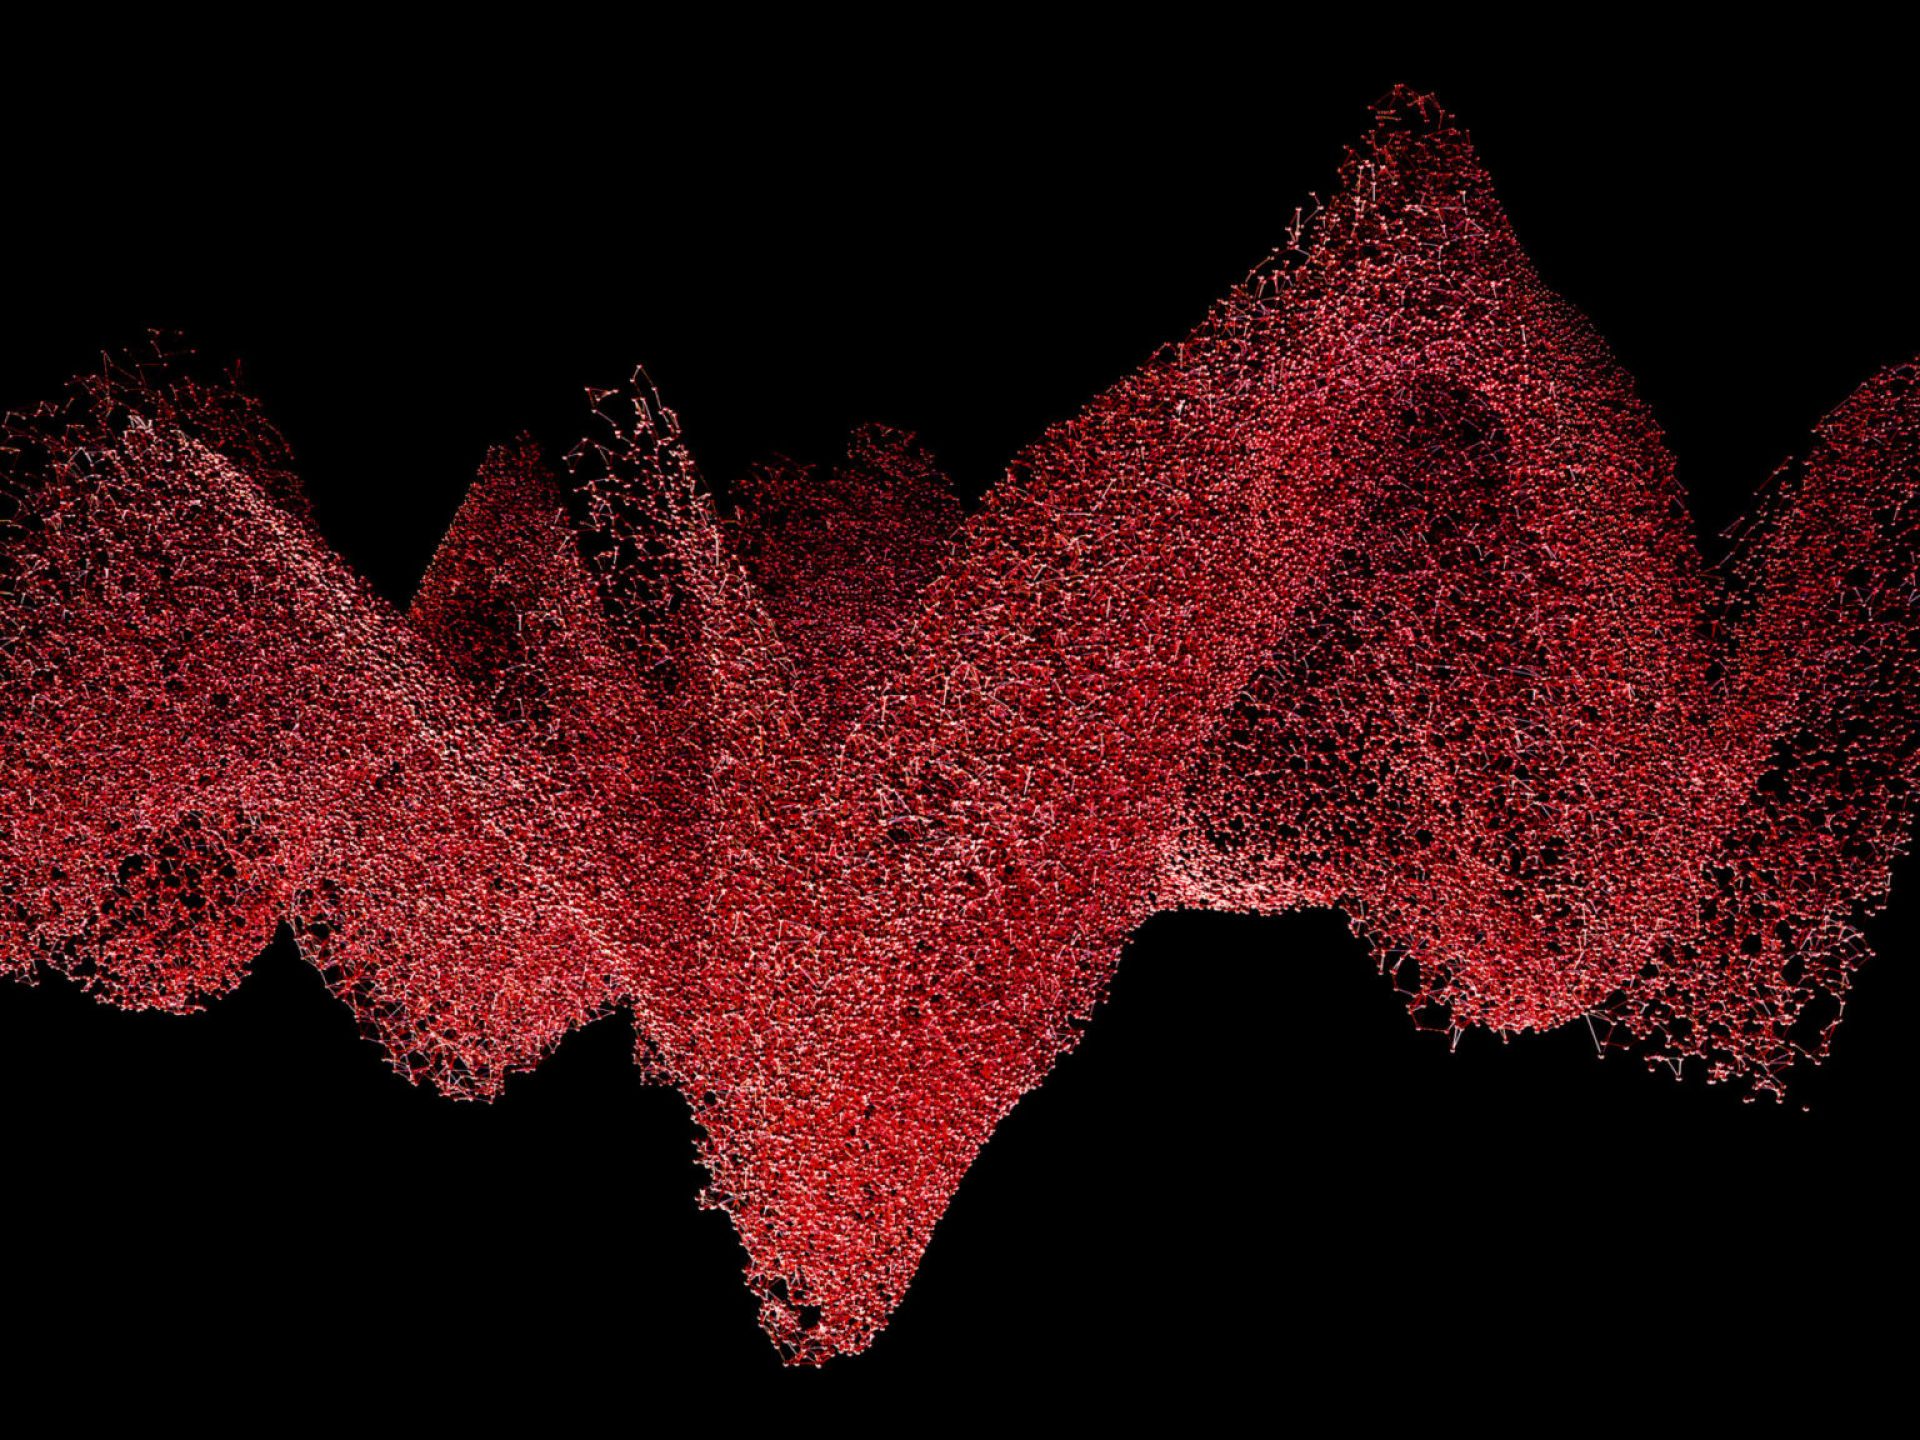
Taking this method of design one step further, it is possible to create structures whose entire form is dictated by sound, with some incredibly interesting results. Populous’ competition entry for the British Pavilion at the 2020 Dubai Expo is one such sculpture. Designed as a celebration of the English language, it is a visual representation of the Magna Carta being spoken, with each data point within the point cloud replaced with a letter from the alphabet.

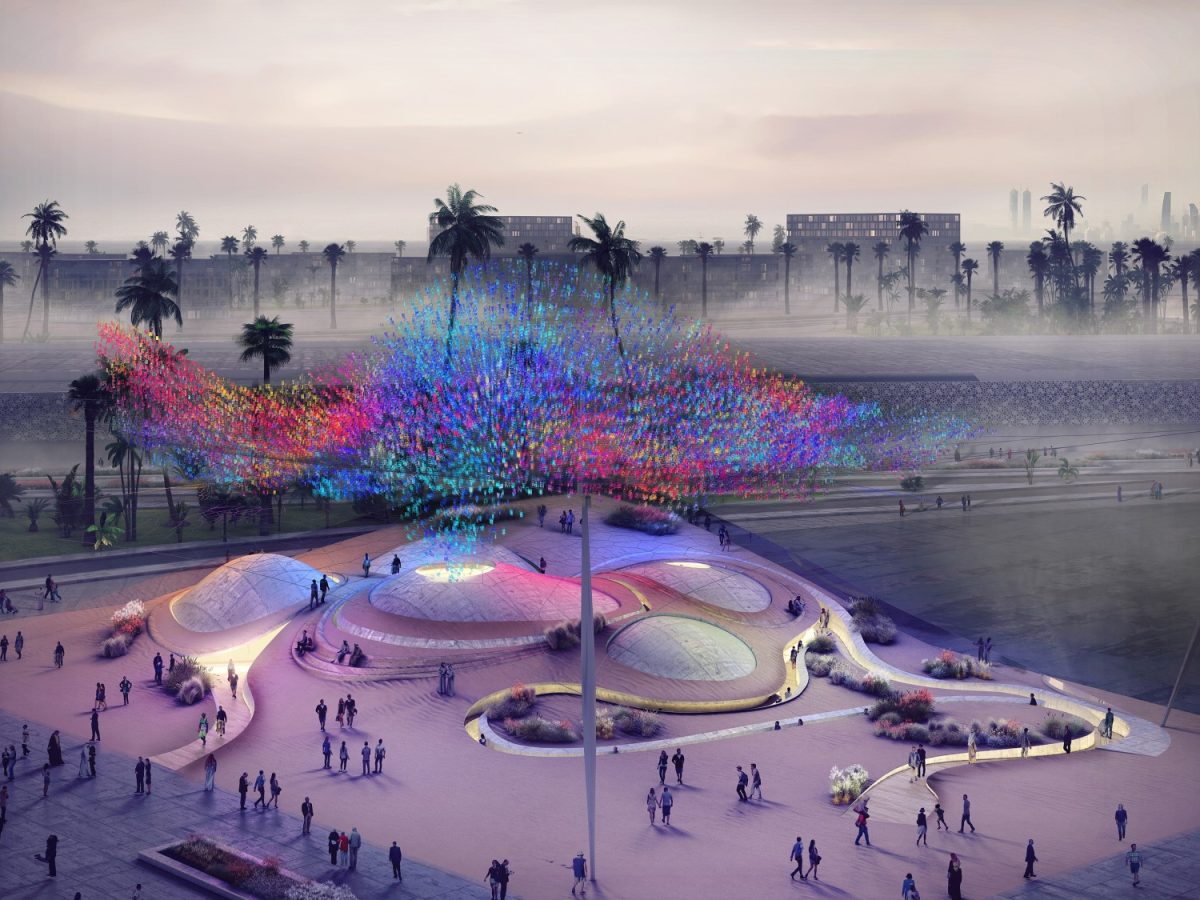
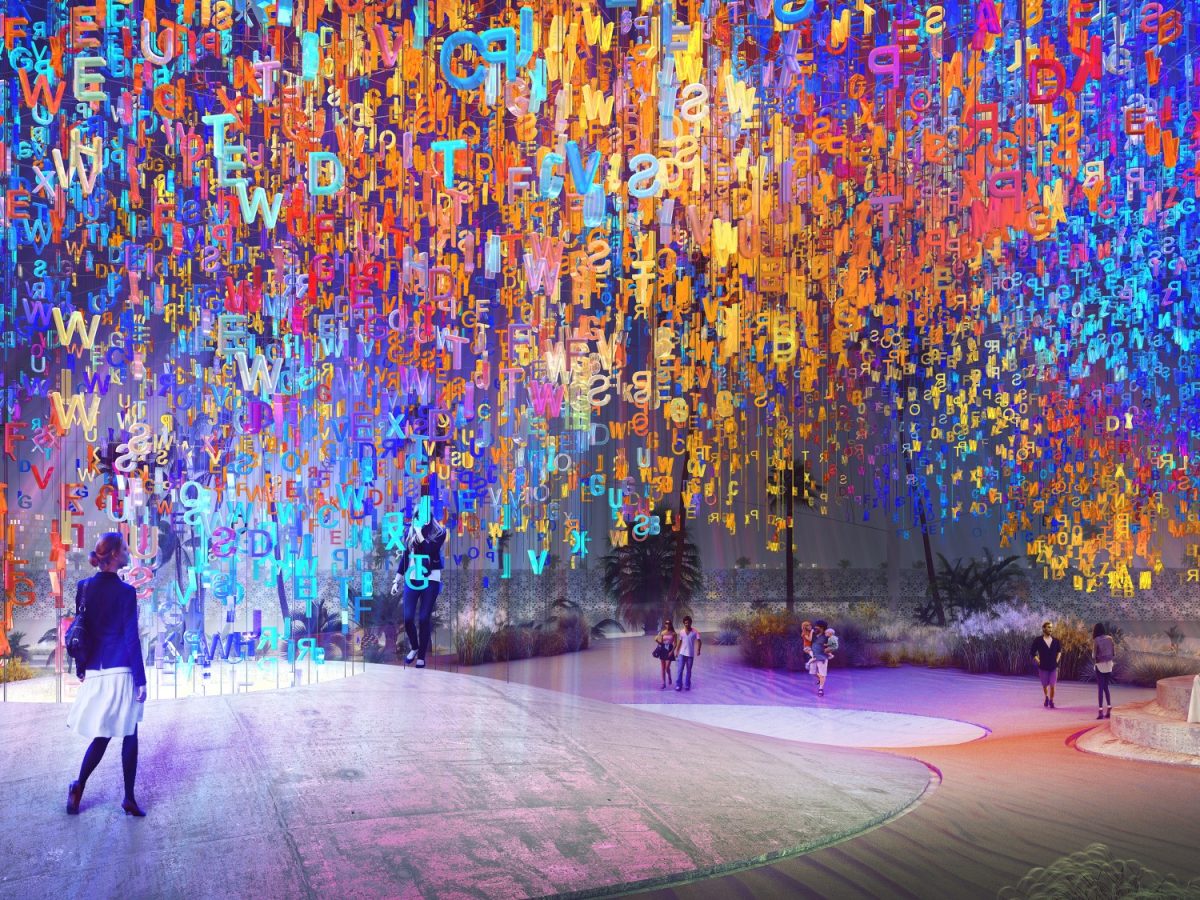
The project shows what can be achieved by embracing sound as a design input, and this is a philosophy that has been incorporated right across Populous’ body of work.
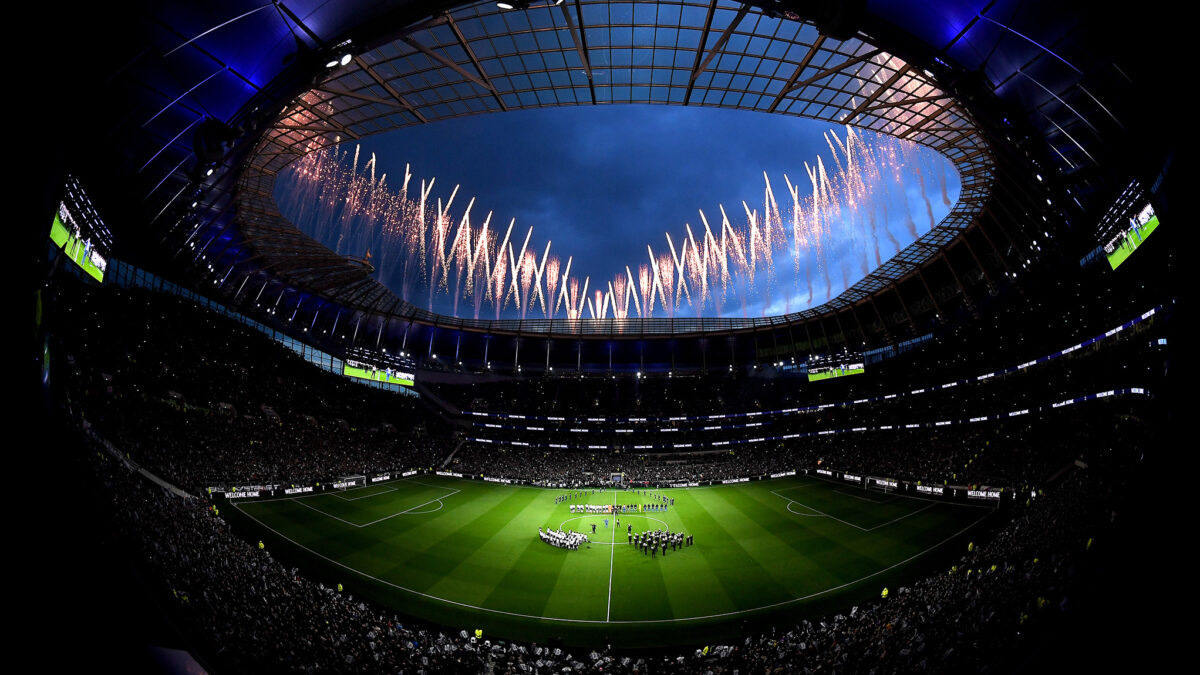
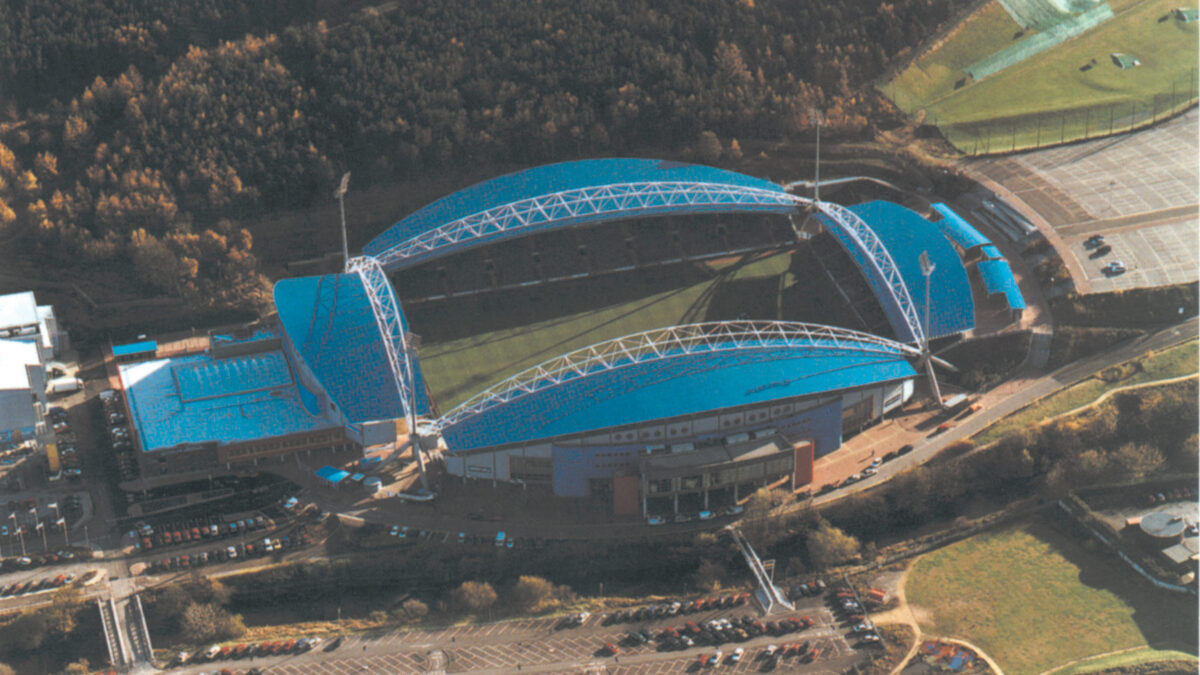
The challenge of creating a loud and intimidating atmosphere at the Tottenham Hotspur Stadium required us to think about sound design from the very start of the project. Using our computer models of the building, acoustics consultants were able to simulate how the sound waves would travel around the stadium bowl. The model was incredibly detailed, showing how the crowd noise would work its way into the various nooks and crannies of the architecture, bouncing off the different surfaces and materials. This insight meant it was possible for us to fine-tune the acoustic performance of the stadium, adjusting the angles of the roof panels and selecting different construction materials to maximise the roar of the crowd, long before the first fan ever took their seat. The client was even able to listen to a simulation of what the stadium would sound like. Needless to say, the end result is better than we ever imagined, and the process is testament to the huge value of sound in the architectural design process.
Perspectives
Perspectives
Perspectives

Lorem ipsum dolor sit amet consectetur, adipisicing elit. Non facere corporis et expedita sit nam amet aut necessitatibus at dolore enim quis impedit eius libero, harum tempore laboriosam dolor cumque.
Lorem, ipsum dolor sit amet consectetur adipisicing elit. Illo temporibus vero veritatis eveniet, placeat dolorem sunt at provident tenetur omnis, dicta exercitationem. Expedita quod aspernatur molestias eum? Totam, incidunt quos.